The first thing that I looked at was the run production for each of the ball parks. The basic idea to pay attention to here is whether a ball park is below or above 1. A park factor of 1 would imply that teams score an equal number of runs at that park versus the league average.

As we can see here, YD has the most extreme park factor of all the Cape League ball parks at 1.14. This is not a surprising result as the YD field was the main reason I conducted this analysis in the first place. To give this some context, the park factor for YD is about equivalent to that of the Colorado Rockies. We can see the main reason for YD being so far ahead of the rest of the fields in the graph below:

These are the park factors for just home runs. YD is even more extreme in this regard. Unsurprisingly there are overwhelmingly more home runs at that field than any other, due to the dimensions of the field in the gaps and in center.
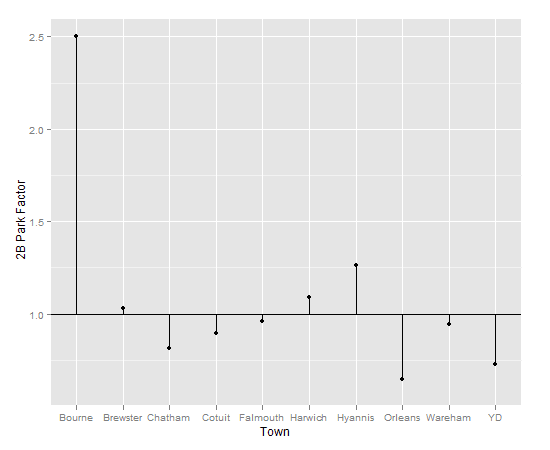
I also made graphs for park factors for doubles and triples. The interesting thing to note here is the astonishingly high park factor for triples in Bourne. I do actually believe the ranking of the park factors is correct, but the magnitude of the park factors for triples seems to be off. I suspect that this is a result of the minimal data we are dealing with. Of all the park factors that I looked at, triples are the most rare event considered. With the compilation of more data, I would expect Bourne to continue to be the top park for triples, with the enormous right and left center field gaps as well as the deep right field fence.

These results could potentially factor in to determining all star teams and all league teams in the future. For example, YD hitters should be slightly penalized when considering their stats, especially home runs. Conversely, YD pitchers should be rewarded for pitching in an extreme hitters park. The opposite would hold true for Bourne hitters and pitchers, as this data shows Bourne to be a strong pitchers park.
No comments:
Post a Comment